For the last few months, I’ve been diving deep into my homelab, building infrastructure and automation. One of my main priorities has been automating logging and monitoring for all my hosts. This led to the creation of an automated monitoring pipeline leveraging Ansible, Grafana, Loki, Prometheus, and Jenkins. This blog will walk through my approach and share some code that might be useful if you choose to replicate this.
The Stack
Here’s a quick overview of the tools I used:
- Ansible: Automates the deployment and configuration of agents.
- Prometheus: Scrapes metrics for performance monitoring.
- Promtail: Forwards logs from the host to Loki.
- Node Exporter: Exports metrics on each host to be scraped by Prometheus.
- Loki: Centralizes and indexes logs from all hosts.
- Grafana: Visualization layer for logs and metrics.
Organizing the Ansible Inventory
First, ensure your Ansible inventory has reasonable grouping. This allows you to organize Prometheus jobs and into logical collections and will help keep your logs organized and searchable.
proxy:
  caddy1:
    ansible_host: 10.0.0.2
  caddy2:
    ansible_host: 10.0.0.3
gaming_servers:
  minecraft:
    ansible_host: 10.0.0.4
Deploying Promtail and Node Exporter Logging Agents
To install the Loki and Node Exporter (Prometheus) agents, I used two Ansible collections: Grafana Ansible Collection and Prometheus Collection.
The Node Exporter agent runs on port :9100 and passively exposes metrics about the host system, such as CPU usage, memory consumption, and disk I/O. Prometheus will be configured to actively scrape these endpoints, pulling the data into our monitoring stack for analysis and visualization.
The Loki agent, also known as Promtail, is responsible for forwarding logs to a Loki endpoint. It sends log data via HTTP/S and supports features like dynamic log label assignment based on file paths or content, making it easier to categorize and analyze logs.
These agents can be installed using two simple Ansible roles, which significantly simplify the setup process:
- name: Install logging agents on all hosts
  hosts: all
  become: true
  roles:
    - role: prometheus.prometheus.node_exporter
    - role: grafana.grafana.promtail
- prometheus.prometheus.node_exporter: The installation works out of the box with no additional configuration needed.
- grafana.grafana.promtail: Promtail requires some custom configuration variables, such as specifying log file paths, labels, and the Loki endpoint URL.
In a later section, I’ll demonstrate a method to generalize these configurations. This will help avoid overly complex or sprawling Ansible playbooks, making the setup easier to maintain and extend.
Generalize the Prometheus Configuration
Installing the agents is straightforward, but Prometheus needs to know where to find the node exported endpoints. This is defined in the /etc/prometheus/prometheus.yml. Manually configuring this file can be time-consuming and prone to errors, especially in environments with many agents.
By using templates and the Ansible inventory file, you can automate the process of writing and updating the prometheus.yml configuration. This ensures consistency, reduces the chance of mistakes, and makes it easier to scale or modify your setup as your environment grows.
Below is an example template for the Prometheus configuration:
{% for group, hosts in groups.items() %}
{% if group not in ['all', 'ungrouped'] %}

- job_name: '{{ group }}'
  static_configs:
{% for host in hosts %}
  - targets: ['{{ hostvars[host].ansible_host }}:9100']
    labels:
      instance: '{{ host }}'

{% endfor %}
{% endif %}
{% endfor %}
This template uses the Ansible groups and hosts to map static configurations for Prometheus. While some cases may require custom exporters or more advanced configurations, this approach covers 95% of deployments in my use case.
To render this configuration file, use the following Ansible task:
- name: Render Prometheus configuration file
  ansible.builtin.template:
    src: "{{ playbook_dir }}/files/prometheus.yml.j2"
    dest: /etc/prometheus/prometheus.yml
    owner: prometheus
    group: prometheus
    mode: '0644'
Generalizing the Promtail Configuration
To generalize the Promtail configuration, I used two methods. The first is leveraging Ansible group_vars, which allows you to set the promtail_scrape_configs and promtail_clients role variables for each group defined in our inventory.yaml. For details about these variables refer to the loki docs.
Currently, I am using group_vars/all.yml, which applies to all hosts and groups. However, if you had a specific use case, such as a group named proxy, you could create a new file, group_vars/proxy.yml, to define variables specific to that group. Variables in group_vars/proxy.yml would override any conflicting settings defined in group_vars/all.yml, providing flexibility for group-specific configurations.
The second method is to generalize how Promtail selects logs to forward. In this setup, Promtail forwards logs from systemd services and files located in /var/log/*.log. In the future, if you stand up a service, as long as it’s associated with a unit file or logs to /var/log, you will have visibility. This approach provides a broad and consistent logging configuration across your hosts, while still allowing for group-specific overrides when needed.
# group_vars/all.yml

promtail_runtime_mode: "acl"
promtail_clients:
  - url: "https://loki.example.com/loki/api/v1/push"

# Scrape logs from /var/log/*.log
promtail_scrape_configs:
  - job_name: system
    static_configs:
      - targets:
          - localhost
        labels:
          job: varlogs
          instance: "{{ ansible_fqdn }}"
          __path__: /var/log/*.log

  # Scrape logs from systemd journal
  - job_name: journal
    journal:
      max_age: 12h
      labels:
        job: systemd-journal
        instance: "{{ ansible_fqdn }}"
        ipv4: "{{ ansible_default_ipv4.address }}"
        ansible_groups: "{{ group_names | join(',') }}"
    relabel_configs:
      - source_labels: ['__journal__systemd_unit']
        target_label: 'unit'
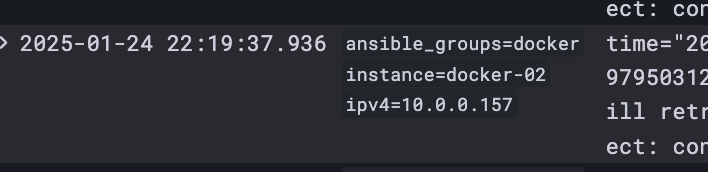
The configuration uses labels to enrich the logs with useful metadata, including the IP address, instance name, group, and the specific systemd unit file name. By adding these labels, logs become much more structured and easier to search, especially when dealing with multiple instances.
Automating with CI/CD
Finally to tie it all together I used Jenkins to run the pipeline and monitor version control for changes. You can chose what ever CI/CD solutions works for you but here is a sample of my pipeline.

The Final Result
With this setup, my homelab is not only fully functional but also highly observable. The logging pipeline ensures that any new host added to the inventory is automatically picked up and onboarded. This eliminates the need for manual configuration for each new device, saving time and reducing potential for error.
For anyone managing a homelab or small-scale infrastructure, this stack I think is a great choice. It’s powerful, flexible, and, best of all, incredibly rewarding to see it working seamlessly in action.